LeanView provides data displays to exhibit process shape data on the value path drawing.
LeanView Process shapes are preconfigured with a Visio data graphic to display user inputs. This data graphic can be edited using the Visio data graphics functionality. (Note: This requires use of Visio Professional or Premium versions. If working in Visio Standard, the data displayed is 'fixed' and may not be edited.)
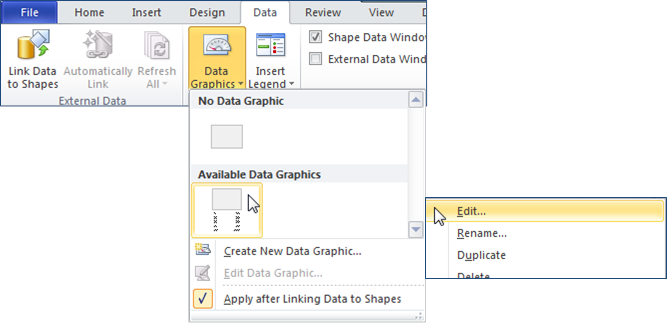
To edit the LeanView Process shape data graphic, navigate to the Data tab on the Visio ribbon, right-click on the LeanView Process Statistics data graphic, and select Edit from the context menu. (Note: It is recommended that you first duplicate the LeanView Process Statstics data graphic and edit the copy, rather than destroying the orginal.)
Once the desired data graphic is created, it may be easily applied to the LeanView Process shapes.
Simply select the Process shapes in the value path, holding down the Ctrl key, navigate to the Visio Data tab and choose the new data graphic from the list.